The pricing logic of SAN/AS (styrene-acrylonitrile copolymer, typically with an acrylonitrile content of 25–30 wt%) exhibits a structural difference from commodity resins: the vast majority of global SAN output does not enter the merchant market as “SAN,” but is instead captively consumed as the continuous matrix phase in ABS production. The volume genuinely traded in merchant form is limited and supply is concentrated, making prices more sensitive to feedstock fluctuations and plant events than nameplate capacity would suggest. The price trajectory from January to October 2026 unfolded precisely under this structure.
Market Positioning and Pricing Logic of SAN/AS
SAN’s clarity, chemical resistance, and rigidity maintain its irreplaceable position in transparent home appliance components, cosmetic packaging, food-contact applications, and glass-fiber-reinforced parts. It sits at the intersection of two cost axes: the styrene chain (sharing a base with GPPS and ABS) and the acrylonitrile (ACN) chain. When both move in the same direction, SAN price elasticity is compressed; when they diverge, producers and buyers must make an anchoring choice between “following styrene” or “following acrylonitrile.” More critically, there is the boundary of merchant volume—much of SAN capacity is integrated with ABS, meaning reductions in ABS operating rates simultaneously curtail merchant SAN availability, so spot supply cannot be inferred directly from total capacity.
Global SAN Price Landscape: January–October 2026
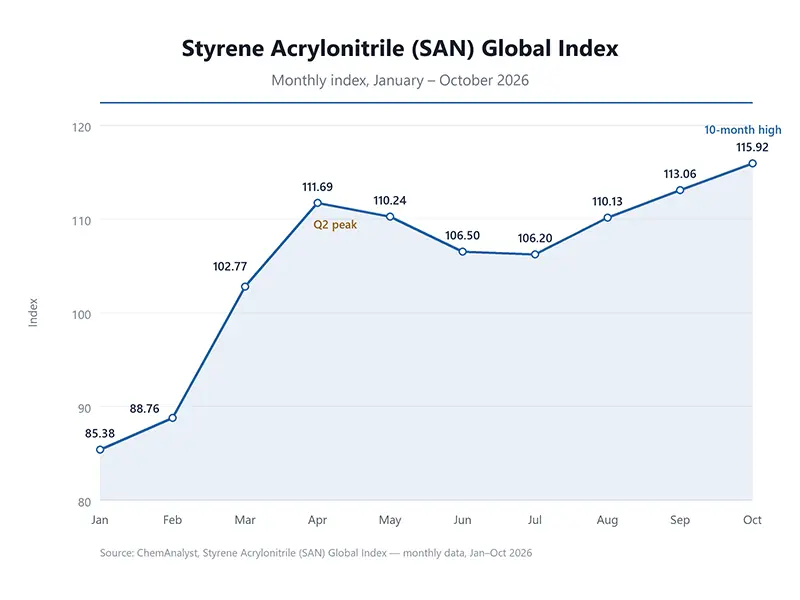
Global SAN prices in 2026 followed a “strong first, softer later” pattern. After trading weakly in the second half of 2025, regional prices moved upward in sync during Q1–Q2—with Q2 increases ranging from 4.17% in Brazil to 41.2% in Indonesia, while the U.S. recorded 21.04% over the same period—before easing after June alongside retreating feedstock costs.
Regional stratification was already clear in Q1: North America was the highest globally at approximately 2,005 USD/t, Europe stood at around 1,884 USD/t, Northeast Asia at roughly 1,361 USD/t, and Southeast Asia marked the low at about 1,098 USD/t. By August, North America held at 1,900–2,110 USD/t, Europe at 1,790–1,980 USD/t, Northeast Asia at 1,290–1,430 USD/t, and Southeast Asia at 1,040–1,150 USD/t, with no directional shift in regional ranking. Full-year reference ranges were roughly 2,000–2,220 USD/t for North America, 1,600–2,240 USD/t for Europe, and 1,360–1,790 USD/t for Northeast Asia.
Regional price spreads existed, yet arbitrage remained friction-heavy. The spread between Northeast Asia and Southeast Asia narrowed rapidly once ocean freight and transit times were deducted, leaving typically brief windows; elevated prices in North America and Europe reflected local feedstock costs and plant reliability premiums rather than deficits that could be easily filled by imports.
China SAN/AS Market Prices and Export Pricing
China accounts for a significant share of global merchant SAN consumption, representing roughly half in 2021 (excluding captive SAN used for ABS). In 2026, the RMB domestic market displayed clear grade tiering: in May Ningbo market offers, Zhenjiang Chimei PN-118L100 was quoted at 13,200–13,400 RMB/t (tax included), Ningbo FCFC NF2200AE at around 12,000 RMB/t, Ningbo LG Yongxing 80HF at roughly 12,200 RMB/t, and Zhejiang Petroleum & Chemical (ZPC) 0250 and 2437 both at 10,500 RMB/t. The 2,000–3,000 RMB/t price gap between high-end certified grades and general-purpose injection grades corresponds to compliance and process costs for food-contact certification, optical consistency, and lot-to-lot stability, rather than mere brand premium.
On an export FOB basis, ZPC cargoes were offered at 1,086–1,268 USD/t FOB Ningbo-Zhoushan, Shandong Haijiang Chemical at approximately 1,423 USD/t FOB Qingdao, and Guangxi Changke at 1,570–1,580 USD/t FOB Qinzhou. This dispersion simultaneously reflects differences in grades, ports, and delivery terms, making direct conversion against domestic RMB prices prone to misjudgment. Comparisons against global regional benchmarks should be aligned on identical specifications and Incoterms.
Cost Transmission Chain: Constraints from Styrene and Acrylonitrile
Upstream costs from January to October 2026 rose first and softened later. For styrene monomer (SM), Jiangsu spot prices averaged 8,421 RMB/t in Q1, up 28.28% quarter-on-quarter from Q4 2025, with a H1 average of around 8,900 RMB/t, up 10.87% year-on-year. The acrylonitrile path was even sharper: after dipping near 7,000 RMB/t at the start of the year, the March monthly average at East China ports surged to 10,305 RMB/t, jumping 37% month-on-month, with a H1 average of approximately 10,419 RMB/t, up 19.92% year-on-year.
During phases when both feedstocks climbed simultaneously, SAN margins were squeezed, with pass-through lags governed by contract structures: contracts indexed to monthly feedstock prices transmitted costs faster with a one-period lag, whereas quarterly fixed-price contracts created price stickiness when feedstocks retreated. Concentrated acrylonitrile capacity additions across 2025–2026 (roughly 1.31 million tons/year added in 2025, with growth remaining above 15% in 2026) compressed the “acrylonitrile premium” during loose periods and amplified it rapidly during plant disruptions, prompting merchant-feedstock SAN units to cut operating rates first. The on-site styrene and acrylonitrile pages serve as reference entry points for upstream feedstock data.
Supply Structure, Capacity Shifts, and Trade Barriers
Two structural events shaped supply in 2026: Trinseo filed for Chapter 11 protection in May while continuing operations, introducing contract continuity and qualification-switching risks for TYRIL® branded supply; and INEOS Styrolution sold its SAN plants in India and Thailand to Styrenix, reshaping the distribution of Asian suppliers. Given the already high concentration of merchant SAN supply, plant ownership and operational continuity carry no less weight than feedstock costs.
China’s ABS capacity evolution exerted indirect constraints on merchant SAN. Total ABS capacity surpassed 11 million tons/year by the end of 2025, with 1.975 million tons of new capacity projected for 2026—a sharp deceleration from the 21% growth rate in 2025 as the industry shifted into stock competition. Slower ABS expansion flattened incremental captive SAN consumption by integrated complexes, though this was partially offset by integrated producers prioritizing their own matrix resin supply.
On tariffs, under HS 3903.20, China’s MFN duty rate stands at 12% and the U.S. general rate at 6.5%, while India’s temporary exemption expired in 2026. While these tariff differentials do not dictate trade flows on their own, when layered with freight rates and certification barriers, they alter the landed-cost ranking of cargoes from different origins.
Procurement and Price Risk Management Framework
Three operational judgments matter more than merely tracking price indices. First, anchor comparable pricing to performance specifications: under the ISO 4894 framework, melt flow rate (MFR) test conditions (230 °C/3.8 kg vs. 200 °C/5 kg), Vicat softening temperature, light transmittance, and residual acrylonitrile monomer limits materially alter price comparability under the same “SAN” name, and a substantial portion of the 20–30% price spread across different quotes stems from delivery terms and testing standards. Second, regional procurement must incorporate the full tariff and compliance chain: anti-dumping duties, food-contact regulatory compliance (including EU purity and declaration requirements effective September 16, 2026, alongside the “non-detectable” rule for acrylonitrile), and vessel schedule reliability should all be factored into total landed cost. Third, preserve contractual flexibility for feedstock divergence: 2026 demonstrated that styrene and acrylonitrile can diverge sharply within a single quarter; anchoring entirely to a single feedstock index exposes one party to asymmetric risk, whereas retaining partial spot exposure or establishing dual-feedstock weighted clauses helps maintain pricing fairness. In a highly concentrated category, qualifying a second source is itself a form of price risk management.
Key Price Watch Variables from Q4 2026 to Early 2027
Late-year price direction hinges on the relative pace of three sets of variables. Whether North American price resilience holds depends on the interplay of local styrene and acrylonitrile costs alongside plant stability; if feedstocks extend their Q4 softening, North American premiums have room to narrow, though concentrated supply will slow that process. Oversupply in Southeast Asia continues to weigh on regional price floors, and its absorption pace directly caps Northeast Asian export pricing. Whether the loose baseline created by concentrated acrylonitrile additions is disrupted by unplanned outages or geopolitical factors remains critical to cost-curve repositioning. Marginal adjustments in tariffs and trade measures—particularly alternative trade flows following the expiration of India’s exemption and the intensity of compliance scrutiny on HS 3903.20 cargoes across markets—could trigger short-term disruptions exceeding fundamentals against an already narrow spread backdrop.